Financial Highlights
IR Library
FY 2025(Year ended September 30, 2025)
Summary of Consolidated Financial Results for Q3(574KB)
Settlement of Accounts for Q3(394KB)
Summary of Consolidated Financial Results for Q2(209KB)
Settlement of Accounts for Q2(465KB)
Summary of Consolidated Financial Results for Q1(301KB)
Settlement of Accounts for Q1(417KB)
FY 2024(Year ended September 30, 2024)
Summary of Consolidated Financial Results for Q4(180KB)
Settlement of Accounts(747KB)
Summary of Consolidated Financial Results for Q3(161KB)
Summary of Consolidated Financial Results for Q2(160KB)
Summary of Consolidated Financial Results for Q1(146KB)
FY 2023(Year ended September 30, 2023)
Summary of Consolidated Financial Results for Q4(178KB)
Settlement of Accounts(750KB)
Summary of Consolidated Financial Results for Q3(147KB)
Summary of Consolidated Financial Results for Q2(160KB)
Summary of Consolidated Financial Results for Q1(146KB)
FY 2022(Year ended September 30, 2022)
FY 2021(Year ended September 30, 2021)
The Company has adopted the "Accounting Standard for Revenue Recognition" (ASBJ Statement No.29),etc.
from the beginning of the first quarter accounting period for the fiscal ending September 30, 2022.
Consolidated
(Million yen)
| Accounting period | FY2020 | FY2021 |
FY2022
|
FY2023 | FY2024 |
FY2025
(forecast) |
|---|---|---|---|---|---|---|
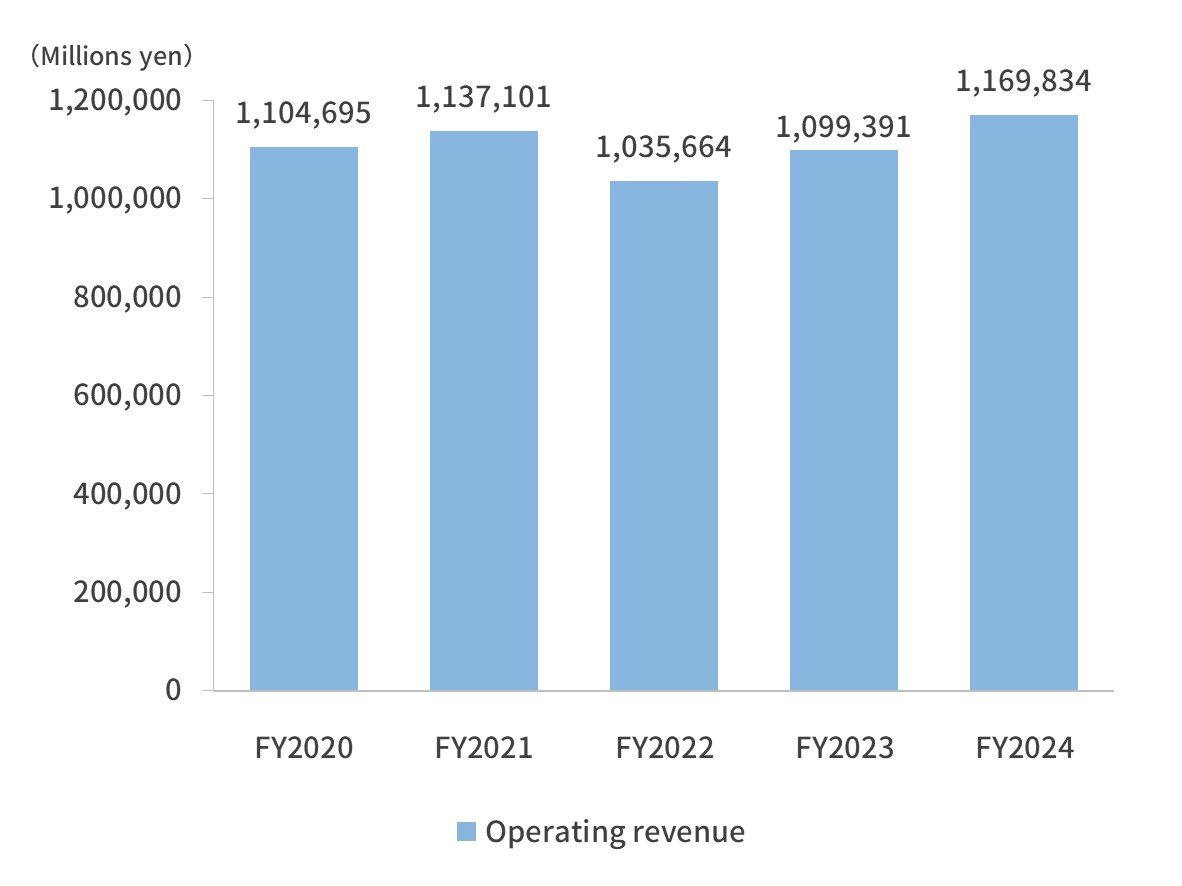
| Operating revenue | 1,104,695 |
1,137,101 |
1,035,664 |
1,099,391 |
1,169,834 |
1,208,000
|
| Operating profit | 11,574 |
11,612 |
13,413 |
16,731 |
16,856 |
16,650 |
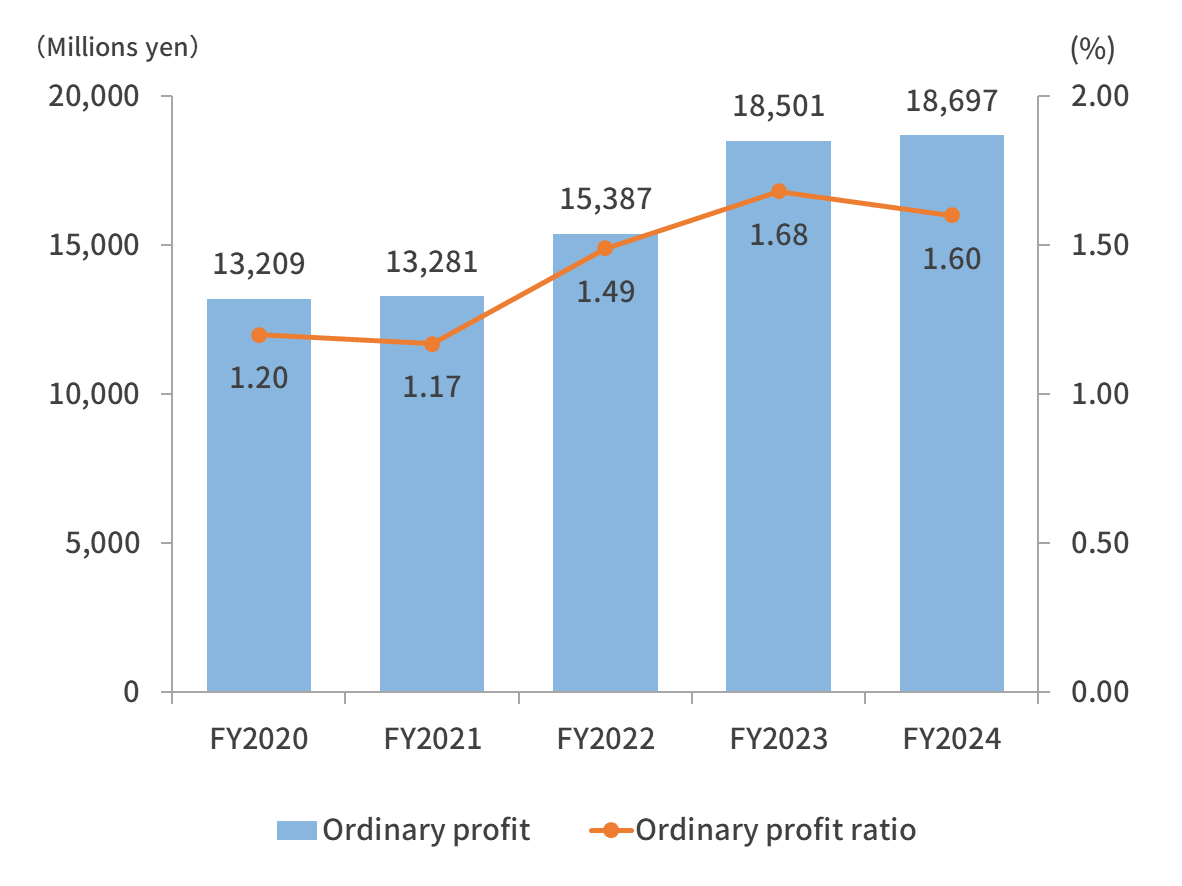
| Ordinary profit | 13,209 |
13,281 |
15,387 |
18,501 |
18,697 |
18,300
|
| Ordinary profit ratio(%) | 1.20 |
1.17 |
1.49 |
1.68 |
1.60 |
1.51 |
| Profit attributable to owners of parent | 9,051 |
8,385 |
11,276 |
12,002 |
14,459 |
11,830 |
| Profit per share(yen) | 253.91 |
238.32 |
329.95 |
356.94 |
453.05 |
379.71 |
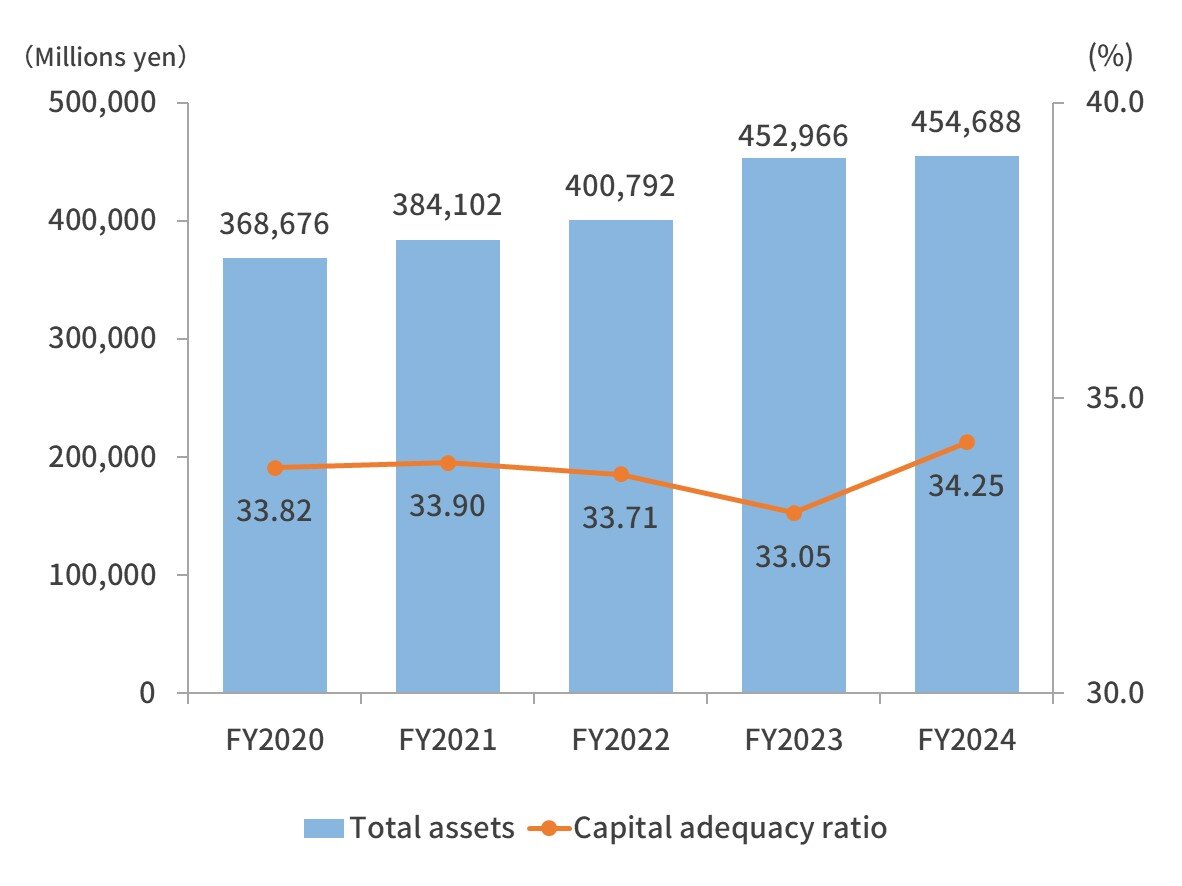
| Total assets | 368,676 |
384,102 |
400,792 |
452,966 |
454,688 |
-
|
| Total net assets | 129,563 |
135,560 |
140,188 |
155,709 |
162,850 |
-
|
| Capital adequacy ratio(%) |
33.82
|
33.90
|
33.71 |
33.05 |
34.25 |
-
|
| Net assets per share(yen) | 3,497.82 |
3,757.48 |
4,018.57 |
4,452.56 |
4,997.86 |
-
|
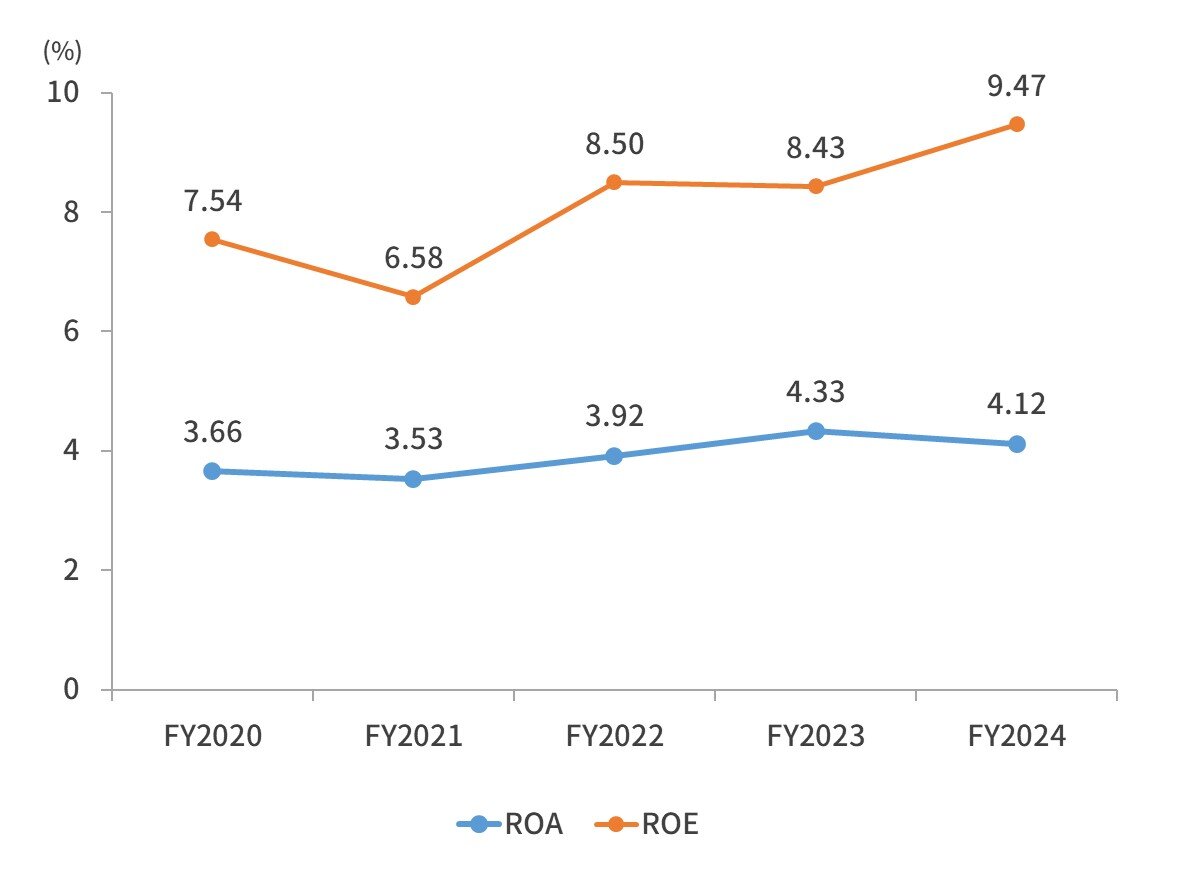
| ROE(%) | 7.54 |
6.58 |
8.50 |
8.43 |
9.47 |
- |
| ROA(%) | 3.66 |
3.53 |
3.92 |
4.33 |
4.12 |
- |
Operating revenue
Ordinary profit&Ordinary profit ratio
Total assets&Capital adequacy ratio
ROA&ROE
Non-Consolidated
(Million yen)
| Accounting period | FY2020 | FY2021 | FY2022 | FY2023 | FY2024 | FY2025 (forecast) |
|---|---|---|---|---|---|---|
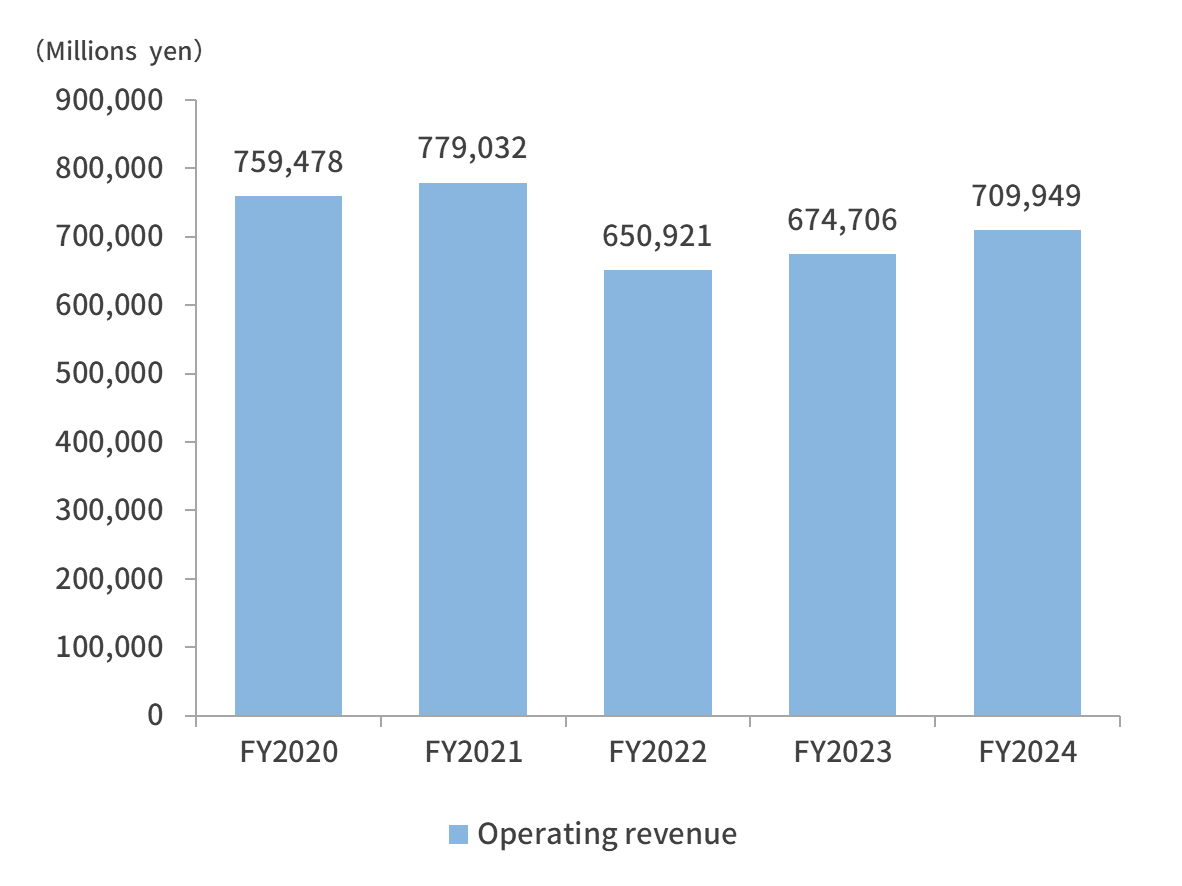
| Operating revenue | 759,478 | 779,032 | 650,921 | 674,706 | 709,949 | 726,000 |
| Operating profit | 10,537 | 10,695 | 11,471 | 13,038 | 13,433 | 12,830 |
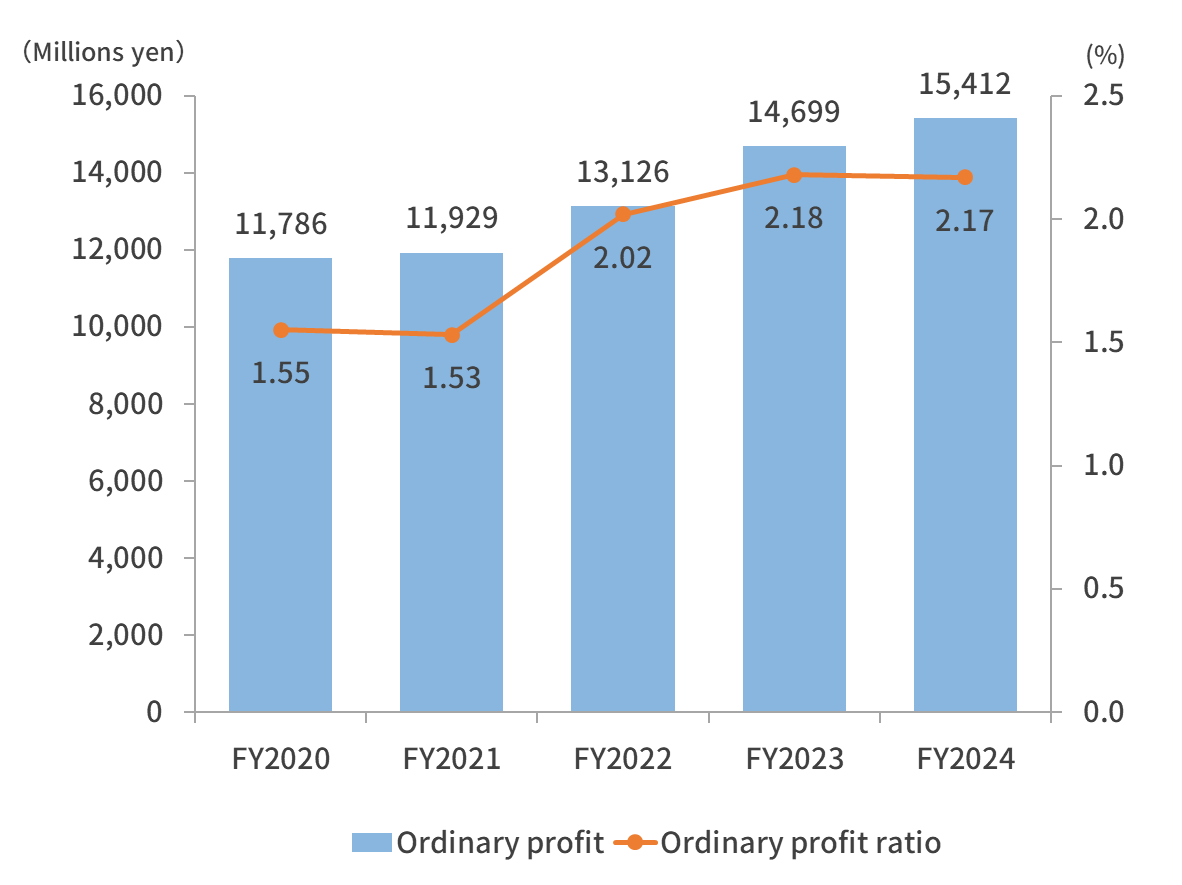
| Ordinary profit | 11,786 | 11,929 | 13,126 | 14,699 | 15,412 | 14,500 |
| Ordinary profit ratio(%) | 1.55 | 1.53 | 2.02 | 2.18 | 2.17 | 2.00 |
| Profit | 8,496 | 8,307 | 10,417 | 10,469 | 12,993 | 10,440 |
| Profit per share(yen) | 238.32 | 236.08 | 304.81 | 311.36 | 407.11 | 335.10 |
| Total assets | 311,996 | 322,987 | 331,526 | 367,292 | 365,444 | - |
| Total net assets | 118,761 | 123,472 | 126,405 | 138,523 | 140,077 | - |
| Capital adequacy ratio(%) | 38.07 | 38.23 | 38.13 | 37.71 | 38.33 | - |
| Net assets per share(yen) | 3,331.32 | 3,563.45 | 3,759.25 | 4,119.67 | 4,496.11 | - |
Operating revenue
Ordinary profit&Ordinary profit ratio
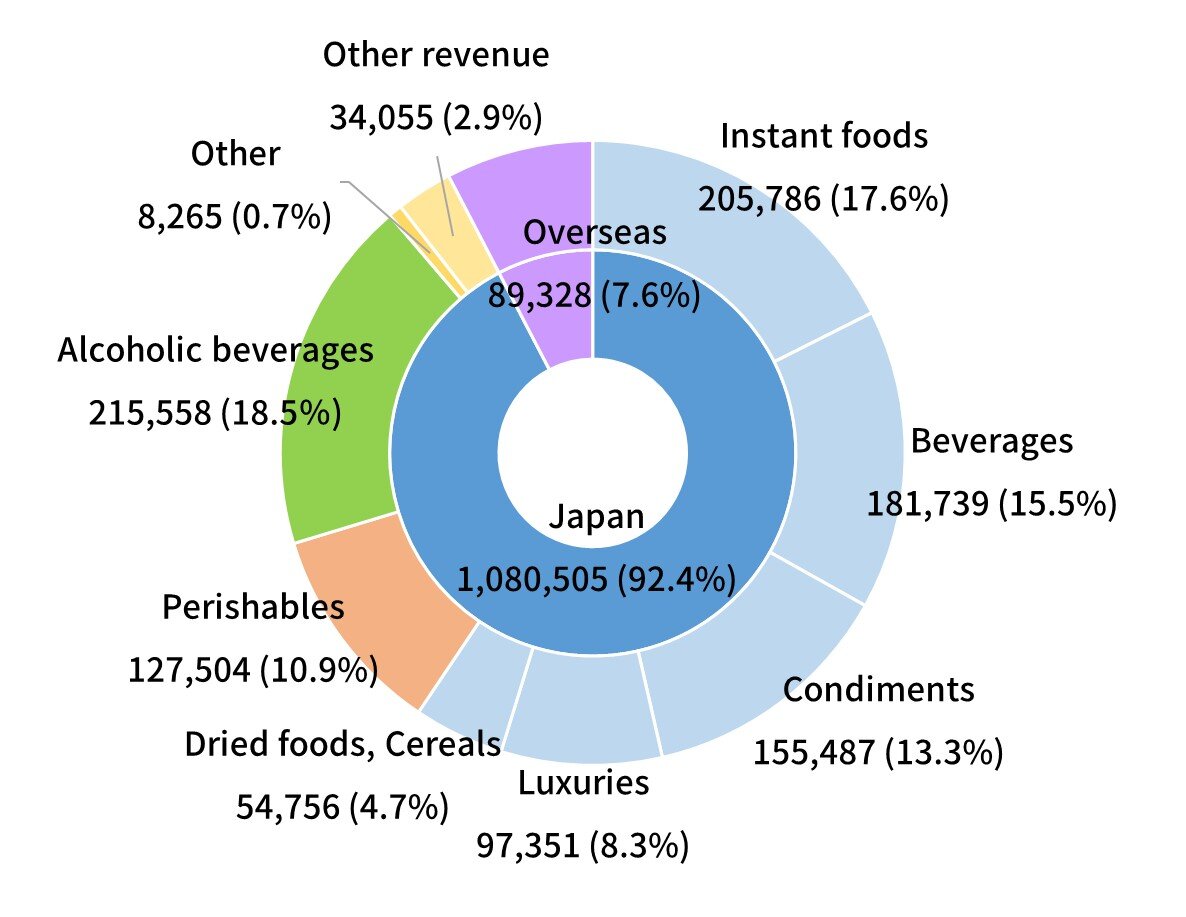
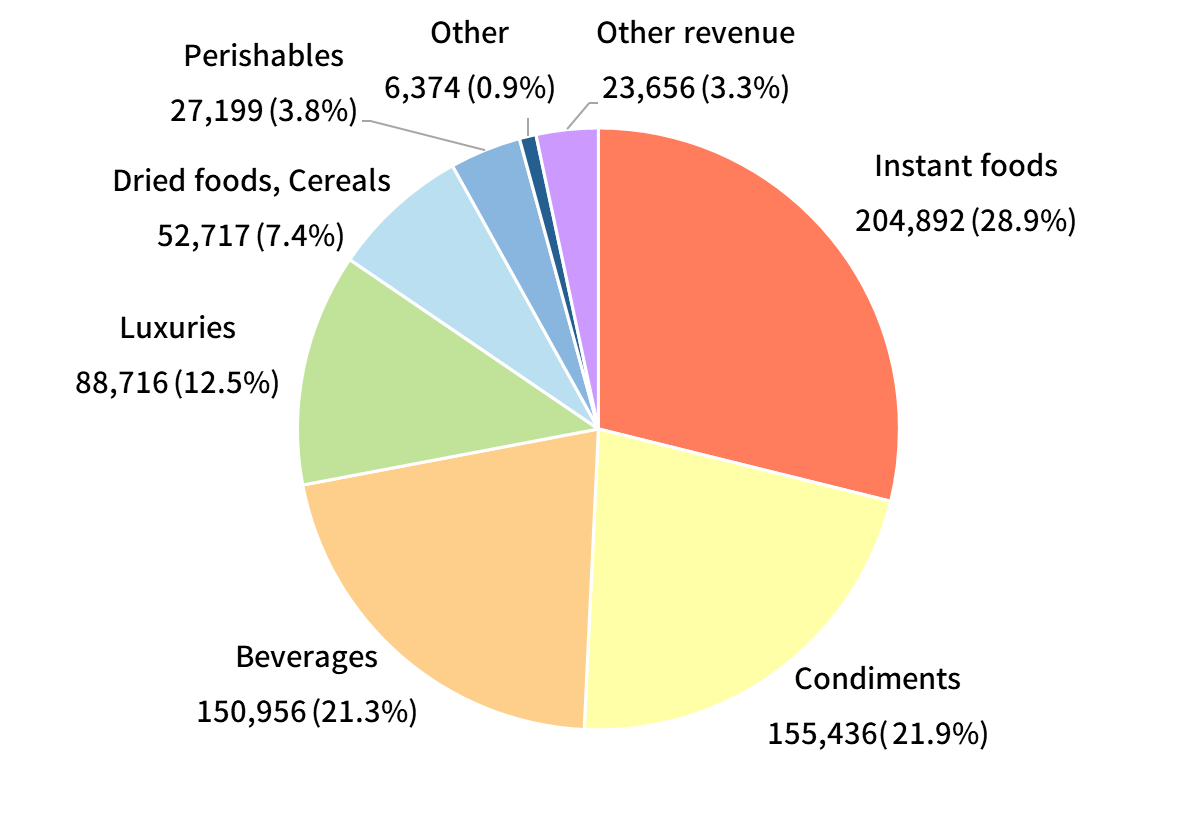
Sales Breakdowns
by product type(Million yen)
(Million yen)
Consolidated
Non-Consolidated
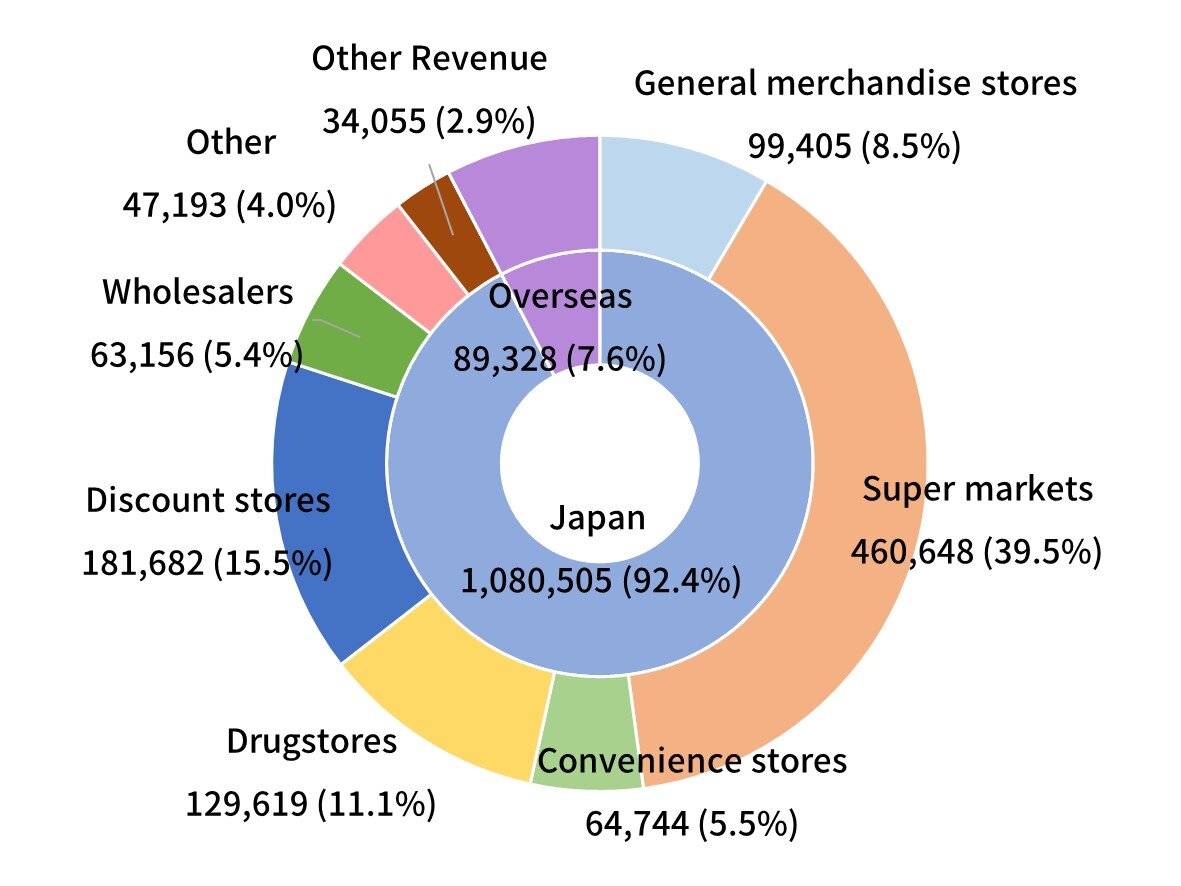
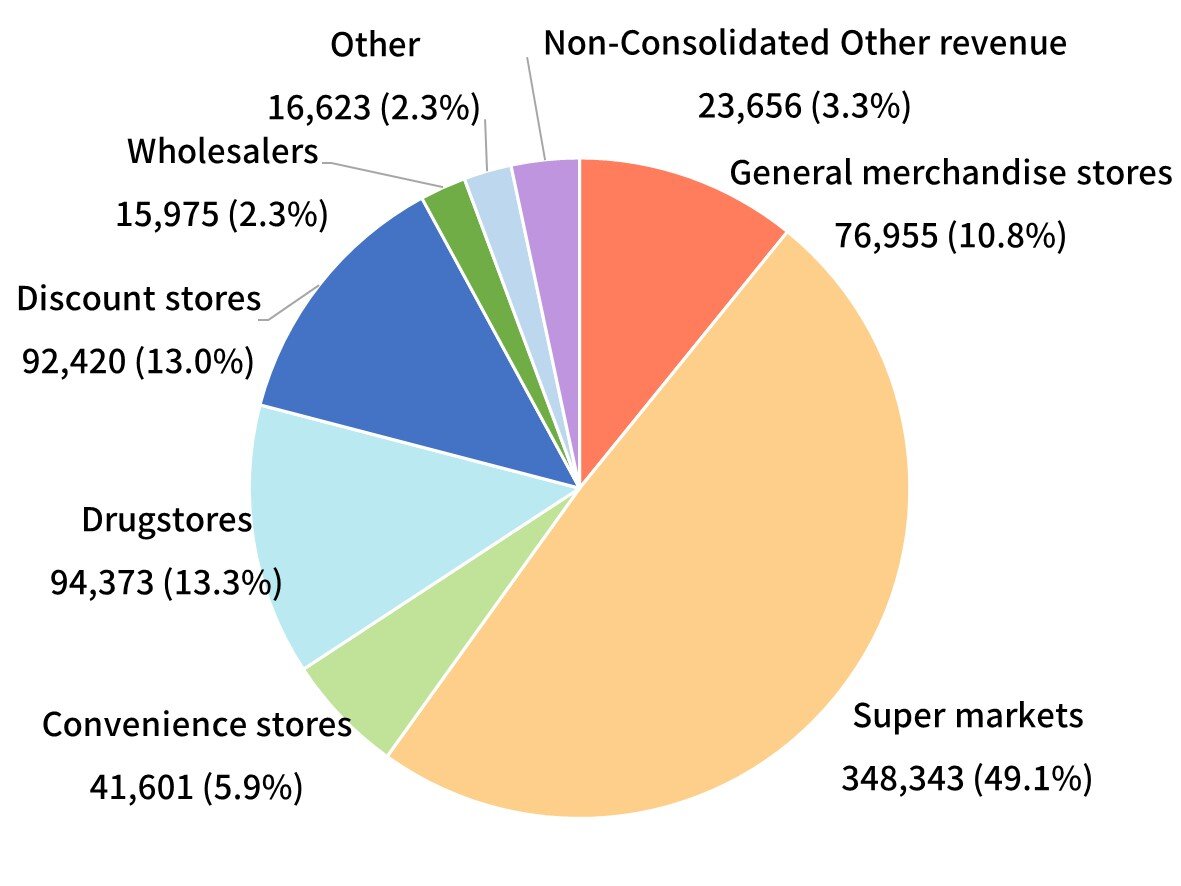
by client category(Million yen)
(Million yen)
Consolidated
Non-Consolidated
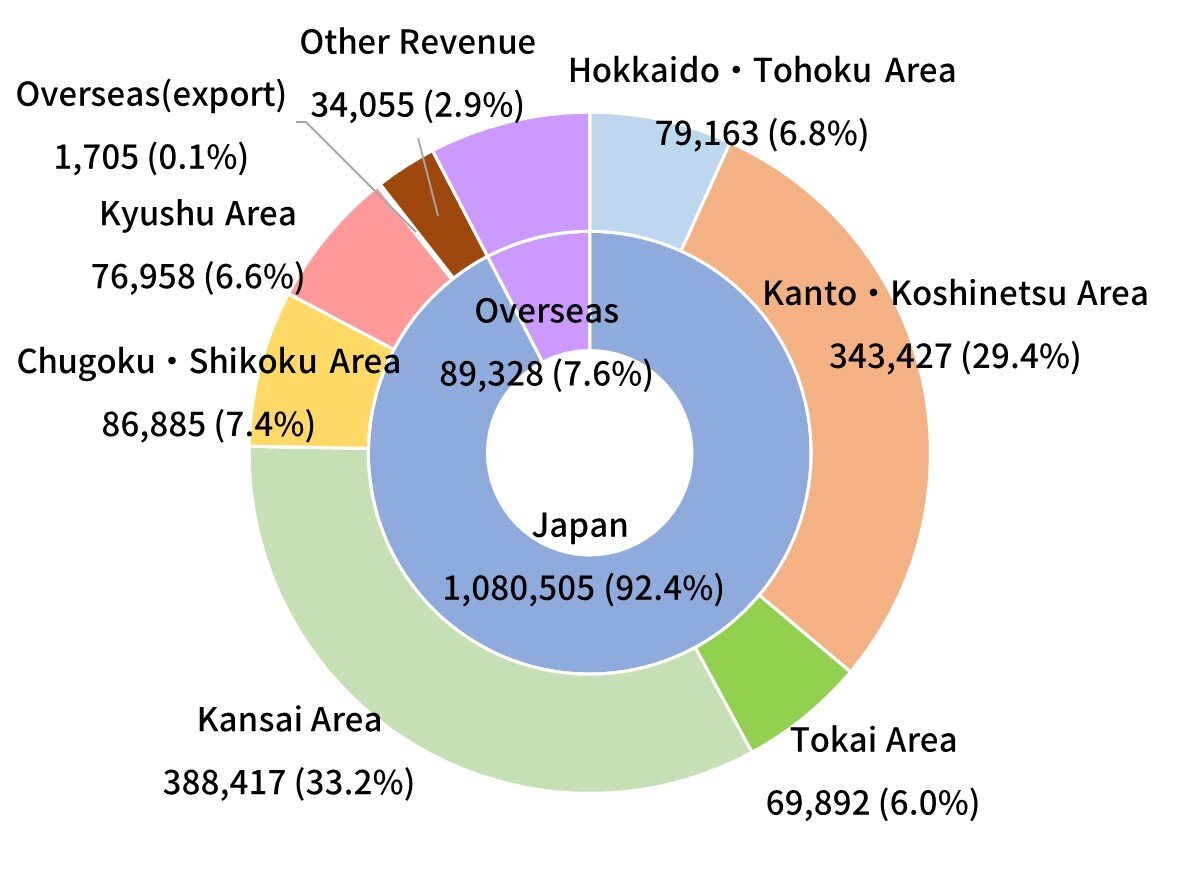
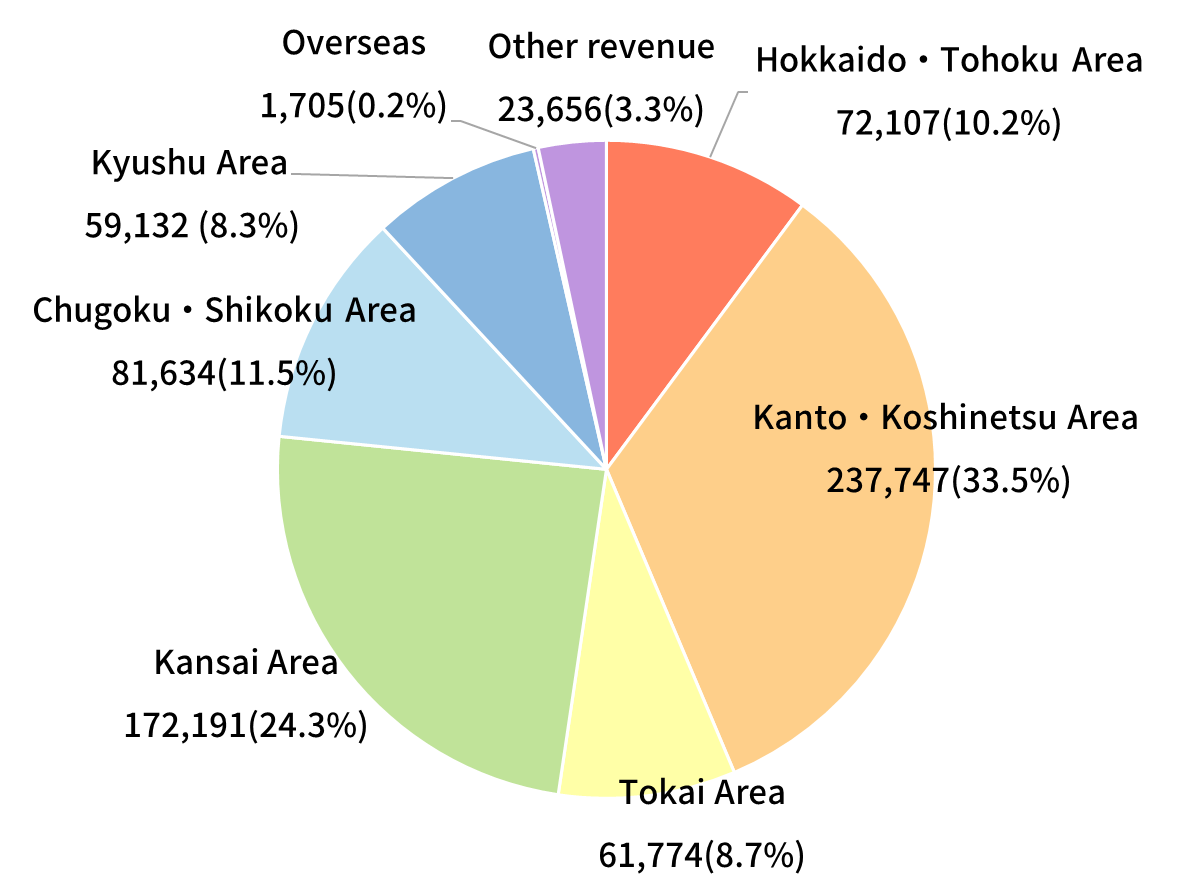
by region(Million yen)
(Million yen)
Consolidated
Non-Consolidated
Segments
Processed Foods Business
(Million yen)
| FY2020 | FY2021 | FY2022 | FY2023 | FY2024 | |
|---|---|---|---|---|---|
| Operating revenue | 764,938 | 781,373 | 656,484 | 681,537 | 717,015 |
| Operating profit | 9,671 | 9,741 | 11,406 | 13,044 | 13,029 |
Frozen and Chilled Business
(Million yen)
| FY2020 | FY2021 | FY2022 | FY2023 | FY2024 | |
|---|---|---|---|---|---|
| Operating revenue | 104,269 | 108,821 | 108,681 | 112,567 | 114,364 |
| Operating profit | ▲96 | 299 | 520 | 1,001 | 1,283 |
Alcoholic Beverages Business
(Million yen)
| FY2020 | FY2021 | FY2022 | FY2023 | FY2024 | |
|---|---|---|---|---|---|
| Operating revenue | 190,048 | 191,893 | 207,535 | 227,072 | 245,211 |
| Operating profit | 558 | 237 | 898 | 1,784 | 1,974 |
Overseas Business
(Million yen)
| FY2020 | FY2021 | FY2022 | FY2023 | FY2024 | |
|---|---|---|---|---|---|
| Operating revenue | 38,904 | 48,594 | 59,573 | 74,714 | 89,328 |
| Operating profit | 151 | 162 | 38 | 294 | ▲203 |